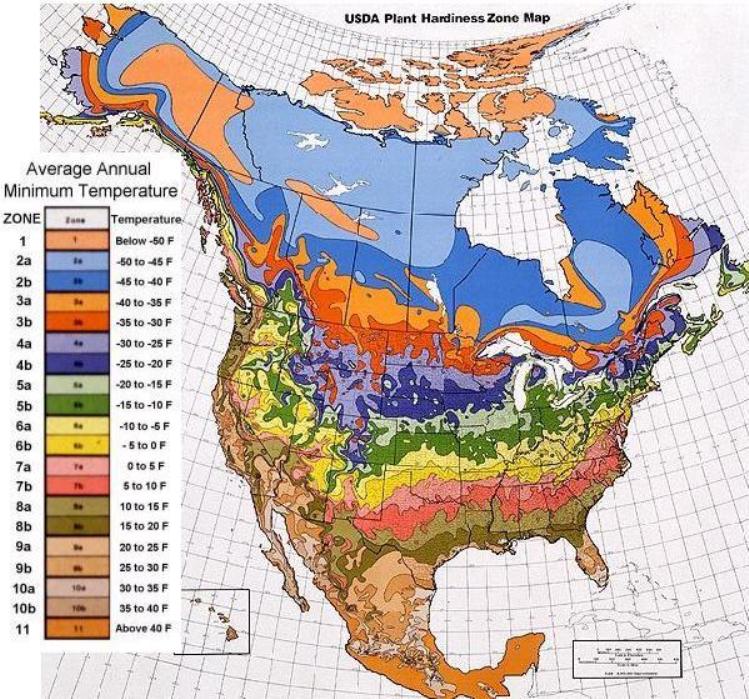
The USDA Hardiness Zone Map is a regional guide that helps gardeners and growers determine which plants are most likely to thrive in specific locations across the United States. Created by the U.S. Department of Agriculture, this map divides the country into 13 zones based on average annual minimum winter temperatures. Each zone is segmented in 10°F increments, ranging from the coldest areas (Zone 1) to the warmest (Zone 13). This tool is especially helpful for selecting perennials, shrubs, and trees suitable for local conditions, enabling better planning and maximizing plant survival rates. The USDA Hardiness Zone Map is widely referenced by gardeners, landscapers, and nurseries across the country.
USDA Hardiness Zone Map
FAQ: USDA Hardiness Zone Map
What is the USDA Hardiness Zone Map, and how does it work?
The USDA Hardiness Zone Map divides the U.S. into 13 zones based on the average annual minimum winter temperatures. Each zone helps gardeners determine which plants can survive winter conditions in specific regions.
How do I determine my specific USDA hardiness zone?
You can determine your zone by using an online map or tool provided by the USDA. Simply enter your zip code or city to see your region’s designated zone.
What temperatures define each USDA hardiness zone?
Each zone represents a 10°F range of minimum winter temperatures. For example, Zone 5 includes areas with average winter lows between -20°F and -10°F.
Why is the USDA Hardiness Zone Map important for gardening?
The map guides gardeners in selecting plants that are more likely to survive the winter in their region, helping reduce plant loss and ensuring a healthier garden.
How often is the USDA Hardiness Zone Map updated?
The USDA periodically updates the map, with the most recent update in 2023. Updates reflect climate patterns and help ensure accurate recommendations.
Can plants grow outside their recommended USDA hardiness zone?
Some plants may survive outside their recommended zones if special care is taken, like mulching for warmth or planting in microclimates, though survival rates may vary.
What is the difference between half zones (e.g., Zone 6a and Zone 6b)?
Half zones represent 5°F subdivisions within each zone, with “a” indicating the colder half and “b” the warmer half, helping with more precise plant selection.
How does the USDA Hardiness Zone Map differ from other climate maps?
The USDA map focuses only on winter minimum temperatures, unlike other maps like the Sunset Climate Zones, which consider additional factors like humidity, rainfall, and seasonal high temperatures.
Can I use the USDA Hardiness Zone Map for indoor plants?
The map is designed for outdoor plants, but knowing your zone can help when selecting plants for outdoor placement in warmer months or to assess their cold tolerance if moved outside.